ENGLAND: THE OTHER WITHIN
Analysing the English Collections at the Pitt Rivers Museum
Acquisition Events: Comparison over time
Chris Wingfield
Researcher 'The Other Within' project
Because acquisition events can be easily allocated to a year, it is relatively easy to plot the number of acquisition events over a time range to give an indication of the changing activity of the museum, just as Janet Owens has done for John Lubbock’s collection (Owen 1999, ; Owen 2006)
By grouping acquisition events by decade it is possible to capture a sense of the changing activity in relation to the English material at the Pitt Rivers since its foundation. Graph 4 below shows this data plotted in red for the changing activity of the museum in acquiring English objects when measured by acquisition events. Plotted against the right hand axis for comparison is the curve formed by the total number of English objects acquired in each decade.
Graph 4: Acquisition events over the course of the museum's history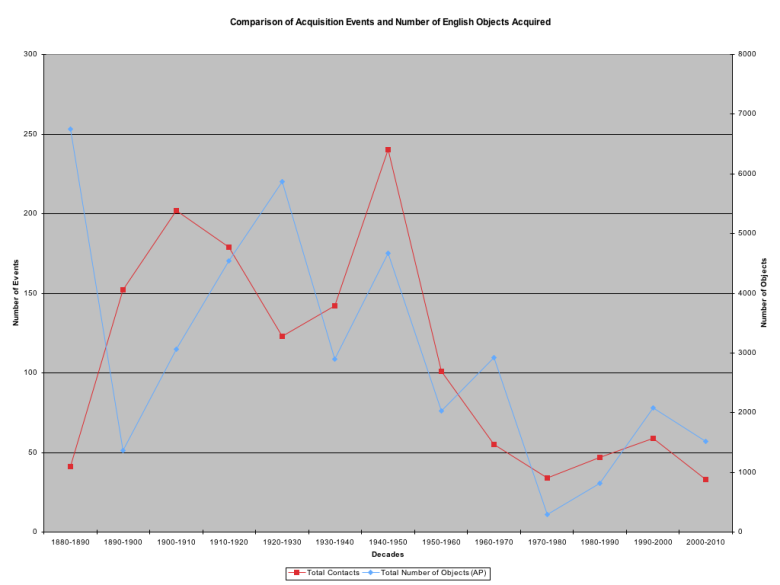
Although one might conclude from both a falling away of activity in the second half of the century, a number of peaks and troughs appear in line for the total number of objects, presumably caused by small numbers of donations of very many objects, such as that of Pitt Rivers in the 1880s and Archibald Bell in the 1920s. These mask what appear to be relatively low levels of activity at the museum when measured in terms of acquisition events. In fact the graph is not unlike that produced by Owen for the Lubbock collection, showing an early peak in activity followed by a dropping away along with a decline in deliberate acquisition through purchasing.
What this graph makes particularly clear is the large peak in activity relating to acquisitions of English material in the 1940s given that this seems to interrupt a general decline in activity after a peak in the 1900s.
Graph 5: Acquisition Events from the 1930s through the 1950s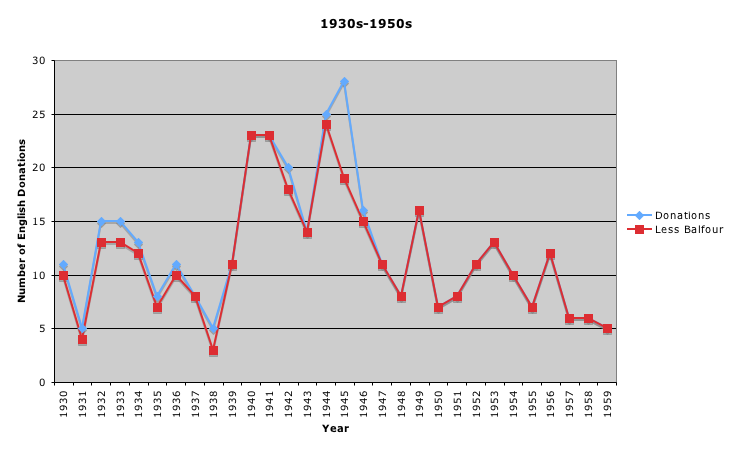
Graph 5 by grouping acquisition events by year rather than decade shows the way in which acquisition activity of English objects seems to cluster around the years associated with the second world war. The red line shows a line that excludes the large peak caused in 1945 by the acquisition of material from Henry Balfour in a number of batches as it was acquired after his death.
How forms of acquisition varied over time
References
Owen, J. (1999). "The Collections of Sir John Lubbock, The First Lord Avebury (1834-1913): 'An Open Book?'" Journal of Material Culture 4(3): 283-302.
Owen, J. (2006). "Collecting artefacts, acquiring empire: Exploring the relationship between Enlightenment and Darwinist collecting and late-nineteenth-century British imperialism." Journal of the History of Collections 18(1): 9-25.